 WhatsApp Us (24/7)
 +91 926 888 0303 (24/7)


Abstract:
Fluid balance (FB) charting is a common practice in wards across all levels of care—primary, secondary, and tertiary. These charts enable treating physicians to accurately assess the patient's volume status and to prescribe drug therapies for those suffering from cardiovascular, renal, hepatic, and surgical conditions. However, in practice, glaring lapses in FB documentation frequently occur. Nursing staff and caregivers often provide estimates of fluid inputs and outputs that are recorded inconsistently, resulting in inadequate clinical assessment. This project aimed to enhance the quality of FB chart documentation by nursing staff through a comprehensive approach to FB monitoring with a reduction in error rates and enhanced efficiency, thereby favourably impacting patient outcomes and minimising transfers from the ward to the intensive care unit (ICU). A pre-intervention audit was conducted over 15 consecutive days on 246 patients’ FB charts. This was followed by a quality improvement intervention, involving nursing education, and a post-intervention audit in a 38-bed multi-speciality ward to analyse the impact on the accuracy and completeness of the input/output charts. In conclusion, this quality improvement project demonstrated that a targeted, robust nursing education programme, along with the introduction of a redesigned colour-coded FB chart can significantly improve the accuracy and completeness of FB documentation, potentially enhancing patient care and reducing the length of hospitalisation
Key words: Fluid Balance, Fluid Balance Chart (Input/Output Charting), Nursing Training Initiative, Quality Improvement Project.
Introduction
While the nursing staff diligently care for patients, several recurring issues have emerged as areas of concern. These include incomplete recording of the fluid balance (FB) chart due to insufficient manpower and a lack of understanding of its importance. The inspiration for this study came from observed lapses in patient care noted by the authors during their routine ward rounds, which were attributable to poor FB documentation and perceived to be preventable. A literature review reveals several quality improvement projects in this domain that have shown improvement in their primary objectives, particularly an article in 2023 by Barretto, Cayla Marie et al., 1 which echoes the objectives of the present study
Study DesignA before-and-after study design was chosen for this quality improvement initiative (QII).
Pre-intervention audit: In June 2024, a detailed audit was conducted on the prevalent nursing documentation practices in a 38-bed multi-speciality ward (medical and surgical) on the 2nd floor of Max Smart Super Specialty Hospital, specifically related to FB charting. (see Appendix-1 – existing Fluid Balance chart). A set of eight variables was assessed on the FB chart of the study day, on a sample size of 246 patient records (both manual and digital records), spanning 15 consecutive days, from 4 pm to 5 pm each day. The variables assessed were as follows: • Accuracy of documenting patient demographic details on the FB chart
• Mathematical error in the calculation of input/output/both
• Fictitious entries on the chart at variance with the clinical progress notes
• Significant gap(s) in the documentation of input/output
• Compliance with measurement and documentation of the daily weight in the FB chart
• Compliance with documentation of intravenous (IV) infusions/ intravenous bolus fluids in the FB chart
• Compliance with documentation of fluid losses other than urine (e.g., ultrafiltration with dialysis, nasogastric aspirate, vomiting, stool losses, and others)
• Compliance with documentation related to the previous day’s cumulative balance on the FB chart
Quality improvement Intervention (QII): From July to August 2024, five nursing education classroom sessions were conducted, emphasising the importance of FB in managing various disease states. The importance of accurate documentation related to the eight variables listed above was also highlighted. Through an interactive PowerPoint presentation, we introduced a newly designed, colour-coded FB chart (Appendix-2).
Post-intervention audit (August-September 2024): This was conducted on a fresh batch of 246 patient records with the same set of eight variables, five days after the completion of the QII. This phase also spanned 15 consecutive days between 4 pm and 5 pm in the same 38-bed multi-speciality ward.
Initial sample size: The total number of FB charts reviewed pre- and post-intervention was 570
Inclusion and exclusion criteria: The inclusion criteria for the study was that the duration of admission in the hospital or duration of stay in the designated study ward to be greater than 24 hours. The exclusion criteria was that the duration of admission to the hospital or duration of stay in the designated study ward to be less than 24 hours.
Final sample size: n= 246 (pre-intervention); n= 246 (postintervention)
Aims and objective: The primary objective of this study was to improve the quality of FB chart documentation by nursing staff through a comprehensive approach to monitoring, with reduced error rates and enhanced efficiency, thereby favourably impacting patient outcomes and minimising transfers from the ward to the ICU.
Data handling: Google Forms were utilised for data collection before and after the intervention. Subsequently, data on each of the eight variables from 246 pre-intervention records and 246 post-intervention records were collated using Microsoft Excel. The data was recorded in a Yes/No format for each variable. McNemar’s test was applied to determine the significance of the QII.
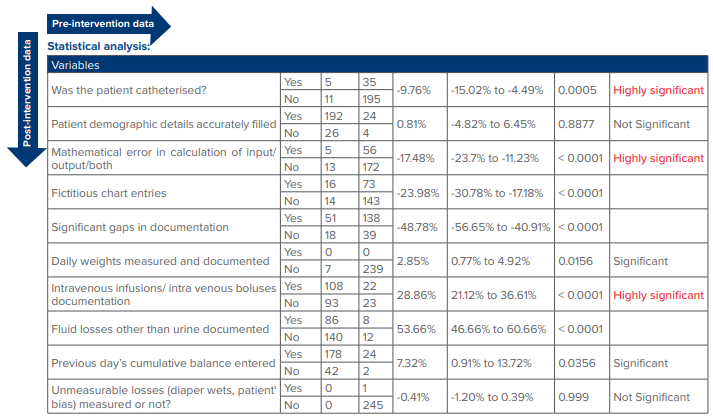
Figure 1: Efficacy of nursing education and training using McNemar’s test.
Each measure was subjected to McNemar’s test to determine the intervention's significance concerning each variable (as shown in Table 1). The McNemar test is beneficial when binary data are generated in pairs and a change in behaviour or practice needs to be determined.
Patient demographic details accurately filledThe test statistics, z = -0.878 and p = 0.8877 were not significant, implying that nursing education and training yielded a mere 0.81% increase in the completion of demographic information, suggesting that the nursing staff has already been performing well in this documentation domain.
Mathematical error in calculation of input/output/ bothThis was highly significant (p <0.0001). The QII significantly reduced mathematical errors in input/output, calculations, with a reduction of 17.48 % in the intervention phase.
Fictitious chart entries
This was also highly significant (p < 0.0001). The intervention reduced false data entry by 23.98%.
Significant gaps in documentation
Highly significant (p < 0.0001). This huge negative deviation of -48.78% implies that the QII significantly closed documentation gaps in the FB chart, improving the continuity and completeness of the recorded information.
Daily weights measured and recorded
Significant (p = 0.0156). A 2.85% in post-intervention weight recording was achieved following the intervention.
Intravenous infusions/intravenous boluses documentation
Highly significant (p < 0.0001). Compliance in documenting of this parameter increased by 28.86%.
Fluid losses other than urine documented
Highly significant (p < 0.0001). There was a 53.66% improvement in recording all types of fluid losses—crucial for accurate FB charting.
Previous day’s cumulative balance entered
Significant (p = 0.0356). Implying a 7.32% improvement in this aspect of nursing documentation performance following the intervention.
Subset of patients with an indwelling urinary catheter
This subset was analysed separately during the audit. In the pre-intervention phase, 40 out of 246 samples had a catheter, compared to 16 out of 246 in the post-intervention phase. Given the ease of monitoring such patients, this subset was expected to demonstrate the most accurate output recording. In the pre-intervention audit, an abysmal 19% of the patients with a Foley catheter (n=40) had timely FB entries. This figure improved to 66.7% in the post-intervention audit (n=16). The reduced number of catheterised patients in the second phase was attributed to the high prevalence of thrombocytopenic dengue cases during the autumn season in New Delhi.
Discussion
The root causes of inaccuracies in FB documentation in nursing care are multifactorial.1-11 These include insufficient and inconsistent training in FB charting, inadequate awareness of the importance of accurate monitoring, and poor communication between medical personnel and caregivers, resulting in uninformative FB charts. The lack of a standardised process flow to capture the input and output data, delays in documentation due to hectic nursing shifts, and unclear FB chart format all contribute to fictitious entries and significant gaps in documentation. Deficiency or malfunctioning of monitoring devices such as IV infusion pumps and confusion related to manual charts viz-a-viz electronic medical record charts further adds to unsatisfactory documentation. There is too much process – more about the system than about the patients. Additionally, there is a significantly high nursing turnover in most tertiary hospitals with inadequate induction of the incoming staff. Poorly designed FB charts (small font size, poorly spaced rows and columns with inadequate demarcation, unclear sub-headers) contribute to nurses' apathy concerning proper documentation
These issues were considered when formatting a new colourcoded chart, with each row or column coded in different coloured shades to highlight the importance of each column. The rows were split according to the nursing shift duties, ensuring the assigned nurse would be solely responsible for documentation and providing an efficient handover to subsequent staff. The chart aimed to facilitate early detection of critical outcomes such as oliguria, high nasogastric aspirate volumes, fluid overload, high drain outputs, and diarrhoeal losses. These improvements could lead to enhanced patient outcomes, fewer incidences of nosocomial acute kidney injury (AKI) and acute pulmonary oedema leading to fewer ICU transfers. A further barrier identified was a lack of encouragement from senior nursing staff, which can demotivate front-line nurses.
This QII was implemented in a 38-bed multi-specialty ward and focused on improving the accuracy of FB monitoring through nursing education and redesigned documentation tools. The findings from this study align with existing literature, which emphasises the importance of accurate FB monitoring in improving patient outcomes, particularly in managing cardiovascular, renal, and hepatic conditions.1,2
Key FindingsThe pre-intervention audit revealed several areas of concern, including significant gaps in documentation, mathematical errors in input/output calculations, and fictitious entries in FB charts. These issues are consistent with findings from other studies that have identified similar challenges in FB documentation.3,4 Post-intervention, there was a marked improvement in the accuracy of documentation, particularly in output charting in catheterised patients (71%), IV infusion recording (28.86%), and documentation of fluid losses other than urine (53.66%). Reducing mathematical errors (17.48%) and fictitious entries (23.98%) was particularly noteworthy, as these are critical to ensuring accurate FB management
The intervention also significantly improved documentation of daily weights (2.85%) and the carry-over of the previous day's cumulative balance (7.32%), both of which are essential for analysing a patient’s volume status. These findings are supported by prior research highlighting the importance of continuous and accurate tracking of FB in preventing complications such as AKI and pulmonary oedema.5,6
Strengths of the StudyA key strength lies in the study’s practical approach to addressing a common yet critical issue in patient care. By focusing on nursing education and redesigning the FB chart, our intervention was feasible and scalable. A before-and-after study design clearly compared pre- and post-intervention outcomes, providing robust evidence of the intervention's effectiveness. Furthermore, the involvement of nursing staff in the design and implementation of our QII ensured that the solutions were tailored to the ward’s specific needs and challenges.
Another strength is the comprehensive nature of the audit, which covered multiple aspects of FB documentation, including demographic details, mathematical accuracy, and the documentation of various fluid losses. This holistic approach allowed for a thorough assessment of the intervention's impact on different aspects of patient care.
LimitationsDespite the positive outcomes, several limitations should be acknowledged. First, the study was conducted in a single ward within a single hospital, which may limit the generalisability of the findings. While the results are promising, further research is needed to determine whether similar interventions would be effective in other settings, such as smaller hospitals with different staffing levels.
Second, the study relied on self-reported data from nursing staff, which may be subject to bias. Although the audit was conducted rigorously, there is always a possibility of some inaccuracies or omissions in documentation. Moreover, the short duration of the post-intervention audit (15 days) may not fully reflect the long-term sustainability of the improvements.
At a personal level, we observed that post-completion of the study, the accuracy of nursing documentation declined after a month, suggesting that ongoing training and reinforcement may be necessary to maintain the gains achieved.
Finally, while the intervention significantly improved documentation, it did not address all areas of concern. For example, the documentation of unquantifiable losses (e.g., diaper wets) remained unchanged, indicating that further refinements to the charting process may be needed, especially in patients who require diapers. This is consistent with findings from other studies, which have highlighted the challenges of documenting subjective or unmeasurable data.8,9
Implications for PracticeThe findings from this study have several important implications for clinical practice. First, they underscore the importance of ongoing nursing education and training in improving the quality of patient care. The significant improvements observed in this study suggest that even relatively simple interventions, such as targeted training sessions and the introduction of more user-friendly documentation tools, can substantially impact patient outcomes.
Secondly, the study highlights the need for standardised protocols and tools for FB monitoring. The success of the colourcoded FB chart demonstrates the value of a clear and intuitive framework for documentation. This finding is consistent with previous research, emphasising the importance of standardised processes in reducing errors and improving the accuracy of FB monitoring.8,9
Finally, the study suggests regular audits and feedback loops are essential for maintaining documentation quality over time. The decline in documentation accuracy observed by the authors during their ward rounds one month after the intervention, highlights the need for ongoing monitoring and reinforcement of best practices. This is particularly important in high-pressure environments, where staff may be more prone to errors due to workload and time constraints.
Disclaimer: This project did not require ethical approval. However, it was approved by the Audit & Administration department, the Nursing department, and the Medical Superintendent of Max Smart Super Specialty Hospital, Saket, New Delhi.
Conclusion
This QII demonstrated that a targeted, robust nursing education program and the introduction of a redesigned colour-coded FB chart can significantly improve the accuracy and completeness of FB documentation by nurses. While the study had some limitations, the findings provide valuable insights into the factors contributing to effective FB monitoring and the potential for simple, scalable interventions to enhance patient care and reduce the length of hospitalisation and cost of care
Praveen Arumugam, Bijjam Venkata Vijay Kumar Reddy, Medam Ashok Kumar Reddy, Kshitij Makarand Gokhale, Alka Bhasin.
Enhancing Patient Care Through a Quality Improvement Project: A Before-and-After Study of Nurse Training on Effective Fluid Balance Monitoring and Charting. MMJ. 2025, June. Vol 2 (2).
References
- Cayla Marie Barretto. Improving Nursing Intake and Output Documentation Utilizing Chart Audits and Staff Education: A Quality Improvement Initiative [Internet]. University of New Hampshire Scholars’ Repository. 2023 [cited Oct 9 2024].
- Jeyapala S, Gerth A, Patel A, et al. Improving fluid balance monitoring on the wards. BMJ Qual Improv Rep 2015;4(1):u209890.w4102.
- Vincent M, Mahendiran T. Improvement of fluid balance monitoring through education and rationalisation. BMJ Qual Improv Rep 2015;4(1):u209885-w4087.
- Luu MN, Wada PY, Levine-Hall T, et al. Using a report card to increase HIV screening in a large primary care group practice. BMJ Open Qual 2021;10(1):e000988.
- Leach RM, Brotherton A, Stroud M, Thompson R. Nutrition and fluid balance must be taken seriously. BMJ 2013;346:f801.
- Perren A, Markmann M, Merlani G, et al. Fluid balance in critically ill patients. Should we really rely on it? Minerva Anestesiol 2011;77(8):802-11.
- Thompson E, Batacharyya M, Bowers A, et al. Quality improvement project: Identifying the barriers to accurate assessment and documentation of fluid status monitoring. Clin Med 2020;20(Suppl 2):s76.
- Daffurn K, Hillman KM, Bauman A, et al. Fluid balance charts: do they measure up? Br J Nurs 1994;3(16):816-20.
- Reid J, Robb E, Stone D, et al. Improving the monitoring and assessment of fluid balance. Nurs Times 2004;100(20):36-9.
- Vincent M, Mahendiran T. Improvement of fluid balance monitoring through education and rationalisation. BMJ Qual Improv Rep 2015;4(1):u209885.w4087.
- Madu A, Asogan H, Raoof A. Education and training as key drivers for improving the quality of fluid balance charts: findings from a quality improvement project. BMJ Open Qual 2021;10(3):e001137.